
Home Prices Are Turning Back Up Nationally. Ours Plateaued.
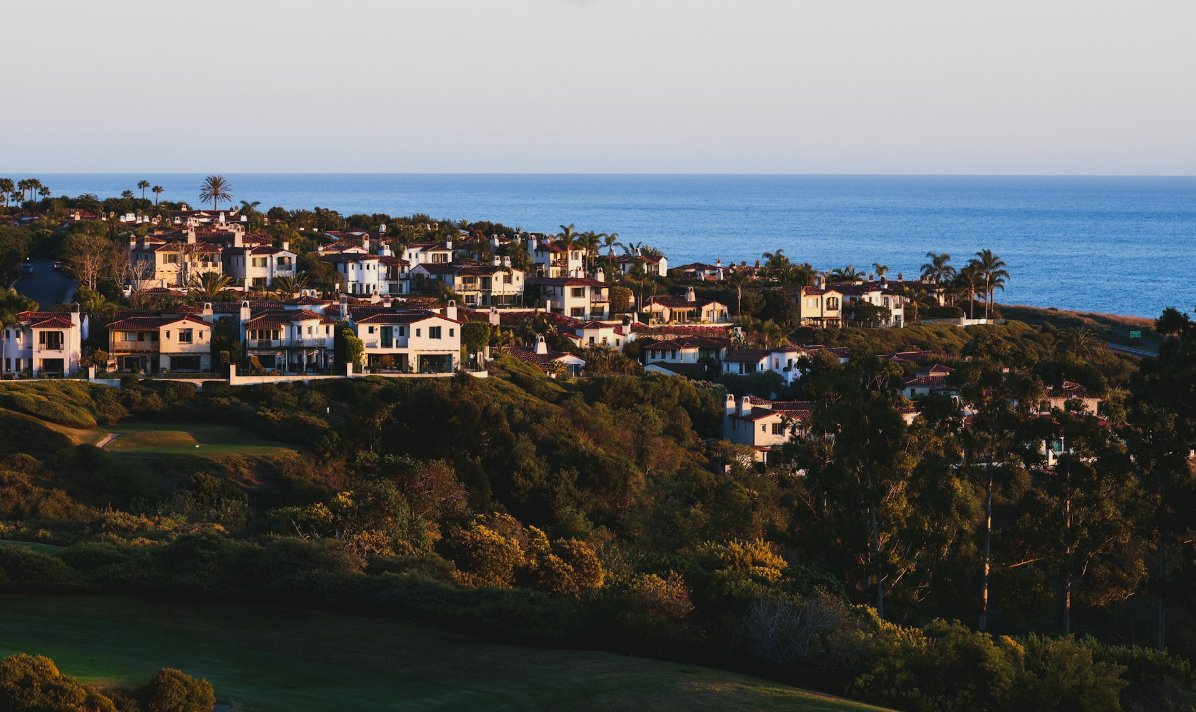
Orange County values rose 1.2% over the past year. The part worth your attention is which homes got faster underneath that flat number.
National price growth has ticked up three months running, and the coverage has been enthusiastic about it. Orange County sat that one out.
What actually changed nationally
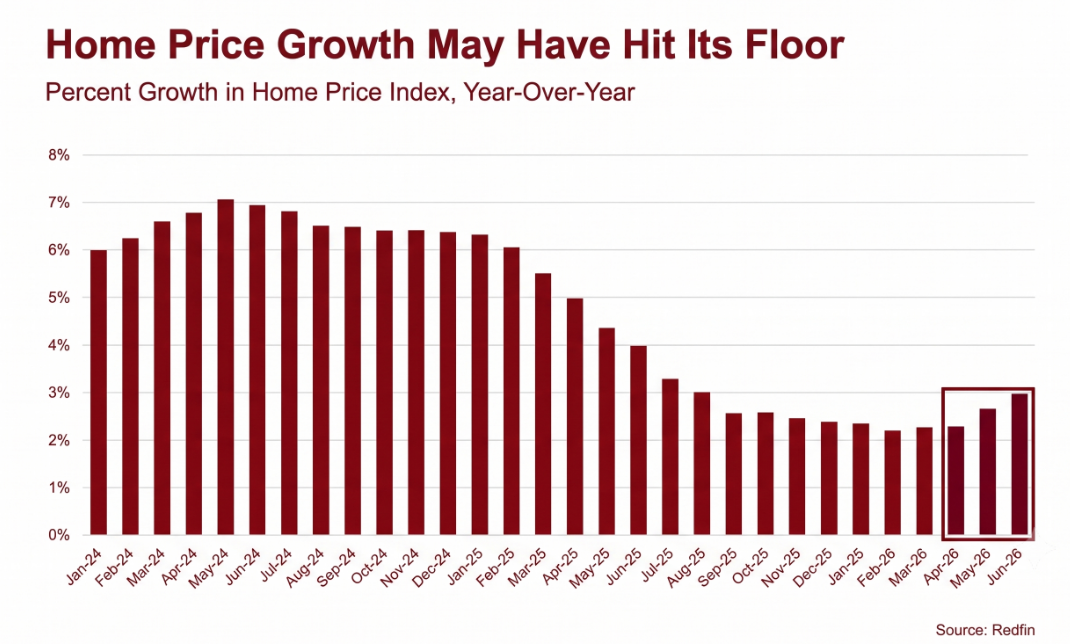
Year-over-year growth cooled from roughly 7% in mid-2024 to a floor near 2.2% in February, then climbed back to about 3% by June. Fewer markets are declining, too: 36% of the 300 largest housing markets had falling prices last summer, and now 23% do. Last month, more than half of major metros posted a month-over-month gain.
The direction is real. It just isn't ours.
The county flatlined, and it's been building toward this
The July 6 Orange County Housing Report from Steven Thomas puts the county median at $1,250,000, up 1.2% over the past year. For context, values ran 8.2% in 2020, 15.2% in 2021, and 10.5% in 2022. Then this.
The rest of the report reads like a market with nothing left to prove. Active listings at 4,697, down 3% from last year and still 43% below the pre-2020 average of 6,708. Demand essentially unchanged. Expected market time at 90 days against 92 a year ago. Sales-to-list ratio at exactly 100.0%, flat.
Nothing is breaking. Nothing is accelerating either.
The expensive homes sped up. The entry homes slowed down.
This is the part we didn't see coming.
Split the county by price band and compare market time to a year ago:
- $1.5M to $2M: 92 days, down from 105
- $2M to $2.5M: 103 days, down from 123
- $2.5M to $4M: 124 days, down from 146
- $750K to $1M: 72 days, up from 65
- $1M to $1.25M: 65 days, up from 59
Every band from $1.5M to $4M improved. The bands where most buyers are actually shopping got slower.
Corona del Mar makes the point loudest: 124 days of market time now, against 210 a year ago. In our experience, that kind of swing in a single year usually means sellers finally adjusted their asking prices to where buyers already were.
What that gap costs, in dollars
Market time is abstract. This part isn't.
In the $1M to $1.25M band, across 291 closings, the median sale price came in $17,000 above the median list price. In the $2M to $2.5M band, the median sale landed $46,500 below list.
Same county, same report. One group of buyers is paying a premium. The other is negotiating a discount worth about a year of property taxes.
Costa Mesa and Newport Beach are not one market
Costa Mesa: 103 active listings, 72 days of market time, median list price $1.6M. Newport Beach: 277 actives, 185 days, $4.8M. Corona del Mar: 124 days and falling fast. Newport Coast: 288 days, up from 236.
Four markets you can drive between in fifteen minutes, running on four different clocks.
What we tell owners
NAR projects the typical U.S. homeowner will gain roughly $16,000 in housing wealth this year, calculated off a national median near $430,000. Apply Orange County's 1.2% to a $1.25M home and you land in about the same place, on a house worth nearly three times as much.
That's what a plateau feels like from the inside. It isn't a loss. It also isn't 2021, and pricing a listing as though it were is the most expensive mistake we watch people make right now.
If you're thinking about a move this fall, or just want an honest read on what your price band is doing rather than what the county average says, we'd love to talk. No pressure, no pitch.
Bernice Devries | Broker | Kastell Real Estate Group — Costa Mesa & Newport Beach
Recent Posts


GET MORE INFORMATION