
The Second Half of 2026 Won't Look the Same Everywhere

National forecasts are calling for a rebound. Orange County's own numbers tell a more divided story, and where you sit in the price stack decides which one applies to you.
Every summer, the national forecasts arrive with the same shape: things were slow, things will improve. This year they might be right. They also might be describing a market that has very little to do with the one outside your window.
The Sales Rebound Requires a Lot of Things to Go Right
Here's the math the national forecasts are running on. About 1.8 million homes sold nationally through May, roughly 370,000 a month. To land the 4.9 million full-year projection, the rest of the year needs to average around 430,000 a month. Every single month would have to roughly match May, which was the strongest month of the year so far.
That's not impossible. It's just a lot to ask.
Locally, the setup doesn't obviously support it. Orange County pending sales slipped to 1,606 in late June, down 2% and past their peak six weeks earlier. That's nearly identical to last year's 1,614. It's also about 67% below the pre-COVID three-year average of 2,679. Demand isn't collapsing. It's been sitting in the same quiet place for two years.
Inventory, meanwhile, is climbing toward its usual July and August peak, and 37% of active listings have already cut their asking price at least once.
Rates Are the Variable That Actually Matters
There's one thing that would change the picture, and it isn't sentiment.
Mortgage rates and oil prices have historically moved together, because energy costs feed inflation and inflation drives rates. Oil has trended down over the past several weeks, and the U.S. Energy Information Administration expects that trend to continue. If it holds, if inflation cools, if overseas tensions ease, rates have room to come down.
That's three ifs. But local demand has been telling us for two years exactly what it's waiting for: rates in the low 6s or the 5s. Nothing else moves the affordability math in a county with a $1.25 million median sale price.
"Prices Are Up 2.3%" Describes a Market We Only Partly Live In
The consensus 2026 forecast is roughly 2.3% national price growth, though the spread underneath that average is enormous. The Mortgage Bankers Association is at 0.6%. NAR is at 4.0%. When the experts disagree by a factor of six, the average isn't a prediction. It's a shrug.
More useful: what actually happened here in May.
Every Orange County price band from $500,000 to $2 million closed at exactly 100% of list price. Sellers in that range got their number. Above $2 million, it breaks. Homes between $2 million and $2.5 million sold at 98.8% of list, a median gap of about $46,500. The $6 million and up tier came in at 96.0%.
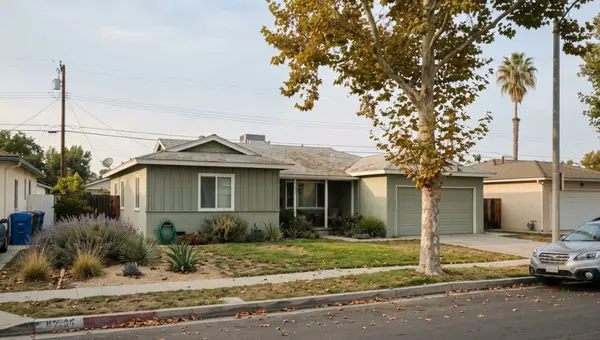
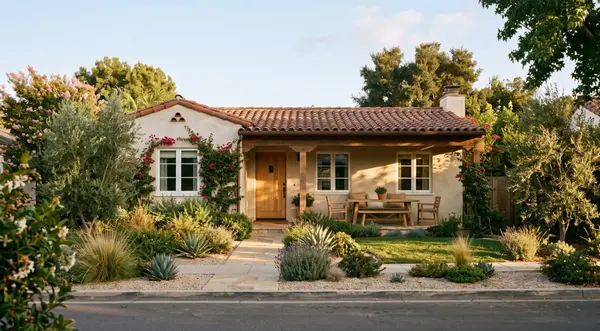
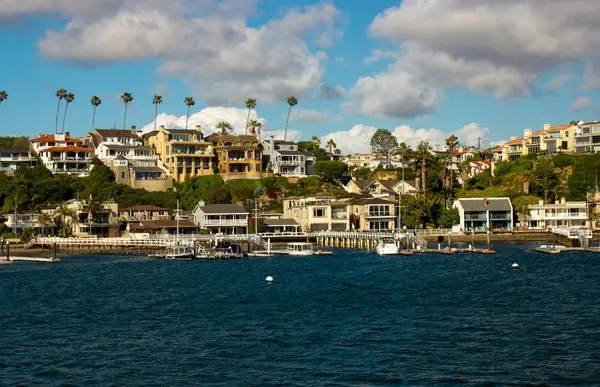
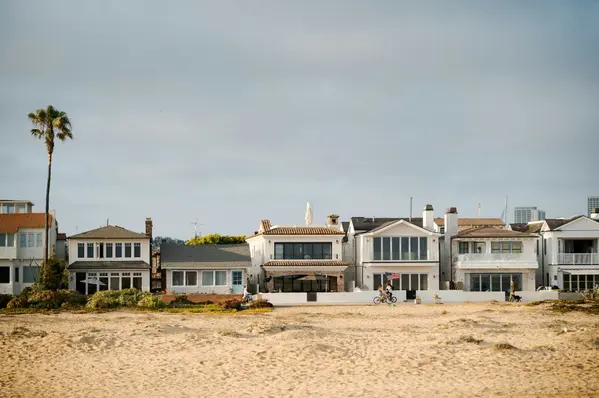
So a Costa Mesa seller and a Corona del Mar seller are reading the same headline about rising prices and living in genuinely different markets. Costa Mesa's median list sits at $1.6 million with a 75-day expected market time. Newport Beach: $4.8 million and 177 days. Corona del Mar: $5.4 million and 148 days.
The Part Nobody Expects
Now the wrinkle, and it's the reason we're not simply telling luxury sellers to brace.
The high end is getting faster, not slower. Homes between $2 million and $2.5 million are moving in about 109 days, down from 123 a year ago. The $2.5 million to $4 million band is at 125 days versus 146 last year. Both bands improved year over year.
The entry and mid tiers went the other direction. Under $500,000 slowed to 97 days from 68. The $750,000 to $1 million range slowed to 74 from 63. Costa Mesa's core price points are still the county's competitive ground, but they're not gaining speed. They're giving a little back.
Read those two facts together and you get something more interesting than "high end weak, low end strong." Buyers above $2 million are showing up in greater numbers than last year, and they're negotiating when they get there. That combination is unusual. It's also a decent argument that the top of the coastal market found its floor somewhere in the last twelve months.
What We'd Tell You Depending on Where You Sit
If you're selling under $2 million, the sales-to-list data says price it right and it sells. What it doesn't say is that you can price it hopefully. Thirty-seven percent of active listings have already cut. Those sellers all started somewhere.
If you're selling above $2.5 million, expect a conversation about your number, and expect it to take a while. But you're likely to have more buyers in front of you than a seller in your position had last summer.
If you're buying, waiting for rates has been a losing trade for two years running. It might stop being one. We don't know when, and neither does anyone quoting a forecast at you.
One More Thing About the Data
Everything above comes from a single two-week snapshot. Reports on Housing updates every two weeks, and the highest price bands run on small samples. Thirty-five homes closed above $6 million. Fifty-two between $4 million and $6 million. Directionally real, statistically thin. We'd rather tell you that than dress up a small number as a trend.
If you're trying to figure out which of these markets you're actually in, that's a conversation worth having. No pressure, no pitch. We'd love to hear from you.
Bernice Devries | Broker | Kastell Real Estate Group — Costa Mesa & Newport Beach
Recent Posts






GET MORE INFORMATION